Sparklines
Note: Sparklines are only available in Highcharts Grid Pro, and also requires a valid Highcharts Core license.
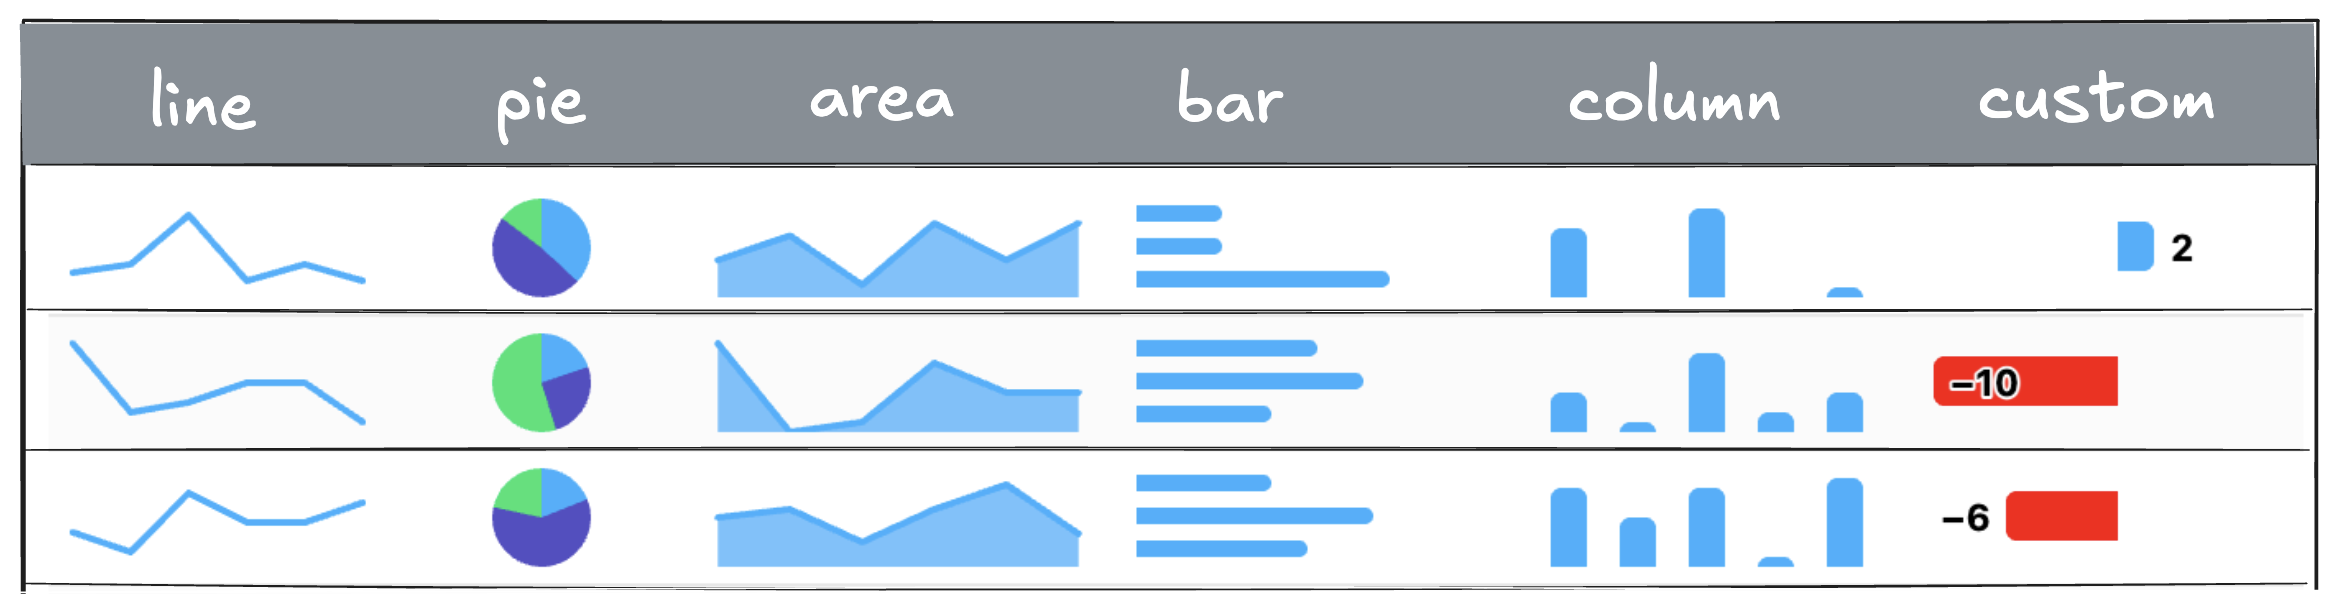
A sparkline is a small, inline chart, typically a line, bar, or area chart, embedded within a cell to visually represent trends or patterns in data at a glance. Unlike full-size charts, sparklines are minimal and non-intrusive, making them ideal for showing changes over time or comparing values directly within rows of a grid, without leaving the context of the table.
Line, bar, column, area and pie are preconfigured as generic, minimalistic sparklines in Highcharts Grid Pro, but you can use chartConfig to configure these further or use other chart types. All chart types and configuration options from the Highcharts Core charting library are available.
Setup
If you’re simply including the highcharts.js file, just make sure to load it before grid-pro.js. If you’re using ES Modules or importing the bundles in the opposite order, you’ll also need to manually register Highcharts by calling SparklineRenderer.useHighcharts(Highcharts) or Grid.ColumnRendererRegistry.types.sparkline.useHighcharts(Highcharts).
Check out the sparklines demo for how to implement sparklines with different configuration options and read more below.
Basic line sparkline
In its simplest form, given that cell data is an array of numbers, a line sparkline can be rendered using:
columns: [{id: 'trend', // column idcells: {renderer: {type: 'sparkline',}}}]
Defaults
Unlike traditional charts, sparklines are typically rendered without axes, coordinates, or labels, making them ideal for summarizing trends in a small space. This is the default chartConfig for sparklines:
{chart: {height: 40,animation: false,margin: [5, 8, 5, 8],backgroundColor: 'transparent',skipClone: true},accessibility: {enabled: false},tooltip: {enabled: false},title: {text: ''},credits: {enabled: false},xAxis: {visible: false},yAxis: {visible: false},legend: {enabled: false},plotOptions: {series: {borderWidth: 0,marker: {enabled: false},states: {hover: {enabled: false},inactive: {enabled: false}},animation: false,dataLabels: {enabled: false}},pie: {slicedOffset: 0,borderRadius: 0}}}
Configuration
You can configure the sparkline using the chartOptions API option, that supports all Highcharts Core API options.
{id: 'trend', // column idcells: {renderer: {type: 'sparkline',chartOptions: {chart: {type: 'bar'},plotOptions: {series: {dataLabels: {enabled: true}}}}}}}
Performance
Sparkline supports all standard Highcharts chart options and is optimized for speed, including virtual scrolling for large datasets.