Data visualization built for software teams

Highcharts gives your team the tools to visualize logs, metrics, performance KPIs, and product data with speed and precision. Build interactive dashboards, embed analytics, and ship better software experiences without adding complexity to your stack.

JavaScript logoJavaScript
React LogoReact
TypeScript LogoTypeScript
Angular LogoAngular
Vue LogoVue
Python LogoPython
Svelte LogoSvelte
Flutter LogoFlutter
GitHub LogoGitHub Logo
Salesforce LogoSalesforce Logo
Paypal LogoPaypal Logo
Alteryx LogoAlteryx Logo
Gainsight LogoGainsight Logo

Trusted by software teams

Developers in healthcare rely on Highcharts because it keeps sensitive data private and secure while delivering the charts, dashboards, and insights their applications need.

Features for Software

“Highcharts supports dynamic data loading and live updates, which is essential for dashboards, monitoring tools.”

Vimal P.

Desktop Support Engineer

Framework friendly

“Highcharts integration is one of the best and easiest I’ve used. It integrates seamlessly with component passed frameworks like Angular, React and Vue.”

Bishop M.

Software Developer

Robust customization

“Highcharts API is really flexible based on well designed fully customizable settings which can tweak your charts nitty-gritty details.”

Attila C.

Angular Developer

Data visualization tools built for software teams

Integrations built for real production apps

Customize everything,
from styling to behavior

Everything you need to ship production-ready dashboards

Highcharts Dashboards gives you a complete framework for building data-rich monitoring and analytics views. Combine charts, KPIs, tables, and custom components into flexible layouts that update in real time.

Built-in data sync

Connect data from multiple external sources and Highcharts Dashboards keeps everything in sync.

Pre-built components

Use our pre-built charts, KPI and data grid components.

Responsive

Highcharts Dashboards uses a layout engine based on Flexbox, ensuring components and layouts adjust dynamically.

Completely Customizable

Our simple configuration options and variable-driven CSS make it easy to theme Highcharts Dashboards.

Confidence for teams that can’t afford surprises

No third-party components

Highcharts ships as a self-contained, self-hosted library with no third-party runtime dependencies, reducing security exposure and ensuring your charts remain stable.

Upgrading is predictable

Our commitment to backward compatibility ensures your data visualizations continue working across versions. If there are breaking changes, we will tell you.

Enterprise-ready reliability

With secure licensing, active maintenance, and dependable release cycles, Highcharts provides the long-term stability required for mission-critical products.

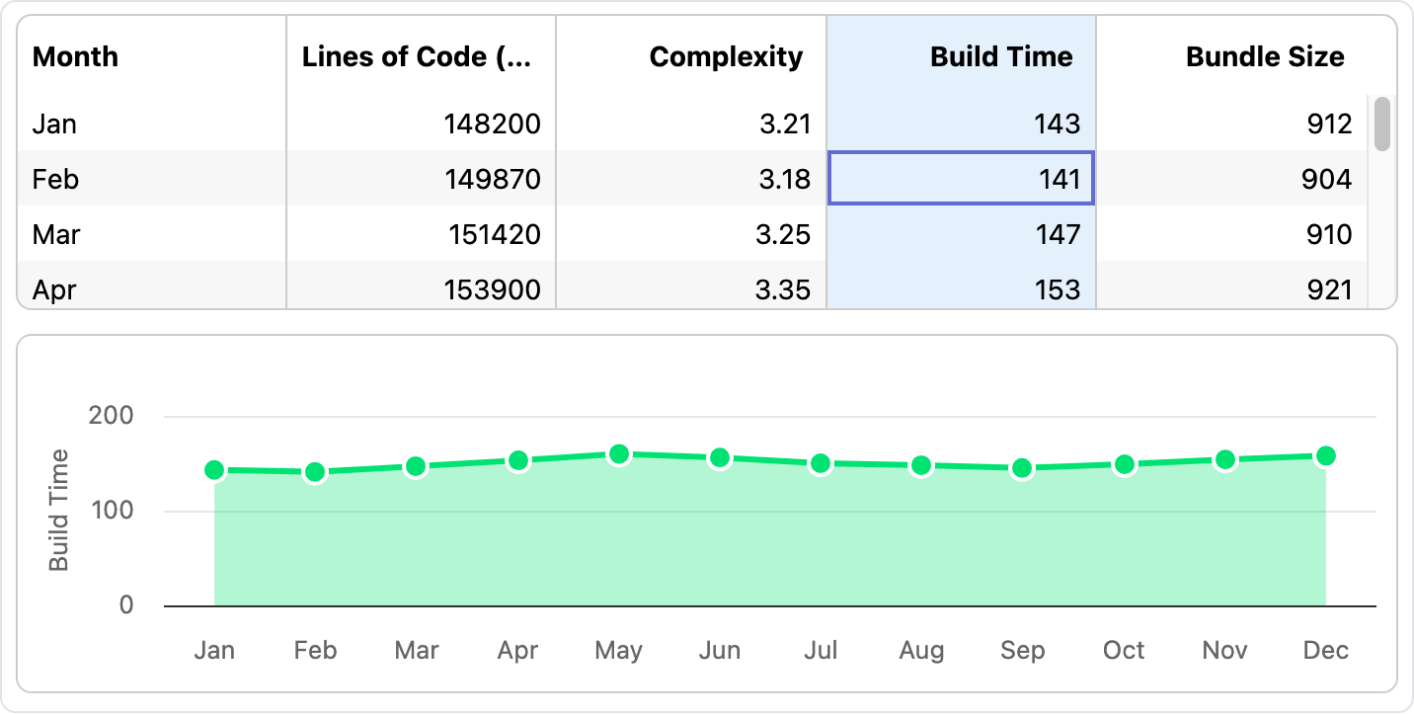
Highcharts for Software in action

Developers across healthcare use Highcharts to power dashboards, tables, and analytics tools. Below are real examples of our components at work.

A smarter way to explore engineering metrics

Highcharts Grid gives software teams a streamlined way to inspect production and CI data. Sort and filter your metrics, then instantly generate charts that reveal hidden trends without leaving the table view. Perfect for dashboards, reporting tools, and developer platforms.

GitHub

GitHub uses Highcharts to present their insight analytics.

Testmo

Testmo uses Highcharts to show test results, highlight QA activities over time, and communicate various KPIs to software teams.

Drivetrain

Drivetrain uses Highcharts in their AI-powered financial platform to visualize actionable insights.

Interested?

Get in touch to discuss your unique use case and how Highcharts can help you make the most of your healthcare data.